Mercedes Torres Torres & Joy Egede – Continuous Pain Estimation for Newborns or How Challenges in Conducting Research in a Clinical Setting Actually Made me a Better Researcher (I think) (Part II)

As part of their medical treatment, newborns in Intensive Care Units go through a number of painful procedures, such as heel lancing, arterial catheter insertion, intramuscular injections, etc. Contrary to the previous conception that newborns are not sensitive to pain, it has been shown that neonates do in fact have a higher sensitivity to pain than older children. In addition, prolonged exposure to pain and use of analgesics may have adverse effects on the future wellbeing of a child and could affect their eventual sensitivity to pain [1].

Nowadays, pain assessment in newborns involves monitoring some physiological and behavioural pain indicators, such as their brows, mouth, nose and cheeks’ movements. Trained nurses will take these measurements right after the procedure and will then monitor changes every two to four hours, depending on the seriousness of the procedure. However, this approach is highly subjective and does not allow for continuous pain monitoring, since doing this would require a large number of trained personnel.

As part of her PhD research, Joy developed an objective pain assessment tool to support clinical decisions on pain treatment. The system uses video, so it is able to provide continuous pain monitoring [2]. However, its development was not straightforward. Originally though to be used to measure pain on newborns, the design had to be changed due to lack of data.

Even after obtaining NHS Ethics approval the data capture process was too cumbersome. It required a Kinect camera to be set up before each different procedure, which then needed to be taken off. This was too time consuming for the team at Queen’s Medical Centre (QMC) in charge of data collection. This, in combination with low recruitment due to the sensitive nature of the procedures that were being recorded, made it virtually impossible to collect data in QMC.

However, through the Horizon Centre for Doctoral Training Impact Fund, we were able to establish a relationship with the National Hospital in Abuja (Nigeria), who agreed to collaborate with us. Staff there were particularly interested in the continuous aspect of the system, since they were dealing with such a large number of newborns on an everyday basis that constant monitoring was a challenge. After obtaining Ethics approval by the hospital panel and receiving training for appropriate procedure behaviour, we were allowed to collect data from different types of procedures, both painful and painless ones. Additionally, trained nurses and physicians helped with the recruitment of parents and newborns.

In three months, from October to December 2017, we were able to collect over 200 videos of infants undergoing painful and painless procedures. This has made a huge difference, since now we have actual relevant data with which to test the tool for assessment developed mentioned previously. Currently, we are working on getting the videos annotated by expert two nurses, and we are looking forward to modifying the general pain assessment tool created in [2] to measure pain on newborns automatically and continuously.

The authors of this post, Joy Egede and Mercedes Torres Torres would like to thank the staff of the National Hospital for their help and support. Moreover, they would like to thank all the parents and newborns who participated in the data collection.

[1] Page, G.G., 2004. Are there long-term consequences of pain in newborn or very young infants?. The Journal of perinatal education13(3), pp.10-17.

[2] Egede, J.O. and Valstar, M., 2017, November. Cumulative attributes for pain intensity estimation. In Proceedings of the 19th ACM International Conference on Multimodal Interaction(pp. 146-153). ACM.

Mercedes Torres Torres, Transitional Assistant Professor, Horizon Digital Economy Research

Mercedes Torres Torres – The GestATional Study or How Challenges in Conducting Research in a Clinical Setting Actually Made me a Better Researcher (I think) (Part I)

For my first postdoctoral position, I was lucky enough to become a member of the Gestational Project, a research project funded by the Bill and Melinda Gates Foundation that was a collaboration between the School of Computer Science and the School of Medicine at the University of Nottingham.

The goal of the project was to create a system that would combine photographs of a newborn’s face, foot and ear to calculate their gestational age right after birth. The gestational age of a baby is important because it measures how premature they are at birth, which directly influences the type of treatment that they will receive. The most accurate dating method right now is an ultrasound scan, but these machines are expensive, require trained personnel and cannot always be deployed to remote areas. In the absence of ultrasound scans, there is a manual method that can be used, the Ballard Score. The Ballard Score looks at the posture and measurements of a newborn in order to determine their gestational age. However, this method is highly subjective and results can vary widely depending on the experience of the person carrying out the exam.

The ultimate idea was to create an accurate system that would combine the objectivity and accuracy of an ultrasound scan and the postnatal measurements of the Ballard Score, therefore allowing non-trained personal to measure the gestational age of newborns. Such method would be useful in remote or under-funded areas where ultrasound machines or trained physicians might not be available or easily accessible.

I found the project fascinating and its area of application, healthcare, was new for me. In my PhD, I had worked in environmental problems, where, if I needed data, I could either download free images from sources like Geograph or go outside and take a picture of plants (you may think I’m exaggerating, but I am not). In other words, data collection was fast, straightforward and I had to think very little about its effects on the design of my algorithm. If accuracy was low, I could go through the motions again, download or take more photos, and see if that helped.

However, when I started working in this project, I realised that my data collection and maintenance habits had to become much more nuanced and serious. Just to get through NHS Ethics took 8 months, which is more than reasonable, since we needed to take photographs of such a protected group. But, even after getting the approval, recruiting participants was, also understandably, a challenge.

To ensure privacy and safety, images had to be stored in encrypted disks and access to them was limited to only the four people working on the project. Only the team at QMC were allowed to recruit and take the photos, so I had no information about the parents or newborns other than their photos and measurements. A downside of this measures is that I have never been able to express my thanks to all the parents (and babies!) who were generous enough to allow the team take photos, even when they were in dangerous circumstances. It was only due to their kindness that we were able to collect any data at all and to them we owe them the success of the project.

The characteristics of the data, including how challenging it was to collect, became a deciding factor in the design of the algorithm. If the accuracy in the calculations was low, I could not rely on additional and instantaneous data collection. Instead, I had to rethink the algorithm design and change it to work with the data we had. Incorporating these notions into our design, we were able to create a system that combined deep learning and regression and that  was able to calculate the gestational age of newborns with 6 days of error in the worst case scenario [1].

All in all, I can say that I loved working on the Gestational Project and that I learned a lot. I think that its challenges made me a more conscious researcher, one who treats data collection and management much more carefully now, independently of the area of application.

Right now, we are working to use the Centre for Doctoral Training Impact Fund to continue to increase the size and diversity of our dataset, hopefully collecting data in other parts of the country and the world. You can find more information about the GestATional Project here.

[1] Torres, M.T., Valstar, M.F., Henry, C., Ward, C. and Sharkey, D., 2017, May. Small Sample Deep Learning for Newborn Gestational Age Estimation. In Automatic Face & Gesture Recognition (FG 2017), 2017 12th IEEE International Conference on (pp. 79-86). IEEE

Mercedes Torres Torres, Transitional Assistant Professor, Horizon Digital Economy Research

Mercedes Torres Torres – Land-use Classification Using Drone Imagery

Land-use classification is an essential environmental activity that involves mapping an area according to the characteristics of the land. This is very useful because it provides information on the types of human activity being carried out in an area. The information in these maps can be then used to study the environmental impact that different planning decisions may have on a community. For example, national agencies will use land-use maps showing industrial, rural and residential areas to decide where different facilities, such as hospitals, or energy plants, or access, such as roads, should be built.

Different classifications can be used, depending on the level of detail needed. Simple classifications may distinguish two classes: buildings and non-buildings. More detailed classifications can include up to nine classes: urban, industrial, formal residential, informal residential, slums, roads, vegetation, barren, and water bodies.

While simpler classifications are easier to obtain, more detailed classifications offer a wider range of information and give a richer picture of the underlying organisation of an area. Nevertheless, while extremely useful, obtaining detailed land-use maps is no easy feat. The most accurate option remains employing human surveyors, who must be trained and are then required to travel to the area to be mapped, pen and paper in hand. As a consequence, manual classification can be subjective, time-consuming, labour-intensive and expensive.

The caveats are specially challenging in fast-developing cities with under-resourced local government. In these areas, centrally-organised mapping is difficult to maintain up to date due to lack of personnel and fast-paced changes in land purpose. Consequently, these areas could benefit from having an automatic way to produce land-use classification maps that is cost-effective, accurate, fast and easy to produce and maintain.

That was the purpose of the DeepNeoDem project. This AGILE project was a collaboration between Horizon Digital Economy Research, the NeoDemographics Lab at the Business School, and the Computer Vision Lab at the School of Computer Science. We used Fully Convolutional Networks (Long et al.; 2015) and drone imagery collected as part of the Dar Ramani Huria project, to show that it is possible to obtain accurate detailed classifications of up to nine different land-use classes.

Interesting results showed that, in some cases, such as the one showed in the figure below, FCNs were able to even beat human annotators, by picking up vegetation and roads which had not been annotated by humans.

Figure 1. FCNs are able to learn roads (red) that are not present in the manual annotations, as well as finding patches of vegetation (green) than were not annotated.

You can find more information in: “Automatic Pixel-Level Land-use Prediction Using Deep Convolutional Neural Networks” by M. Torres Torres, B. Perrat, M. Iliffe, J. Goulding and M. Valstar. Link here.

References:

[1] Long, J., Shelhamer, E. and Darrell, T., (2015). Fully convolutional networks for semantic segmentation. In Proceedings of the IEEE Conference on Computer Vision and Pattern Recognition (pp. 3431-3440).

Mercedes Torres Torres, Transitional Assistant Professor, Horizon Digital Economy Research

Mercedes Torres Torres – Unobtrusive Behaviour Monitoring via Interactions of Daily Living

Nowadays, most of our daily living entails constant interactions with different utilities and devices. Every time you turn on your kettle, take a shower, send a text or buy something with your card, information about this interaction is collected by different companies, such as your energy, water, telephone provider or bank. These companies may then use that data for different purposes, for example to recalculate your tariffs or to suggest further services.

The goal of the Unobtrusive Behaviour Monitoring project is to combine all the information that we are continuously generating through daily interactions with technology and to feed it back in a constructive and organised way so we can see different patterns in our behaviour. This type of analysis could be particularly insightful for people who suffer from mood disorders, who could use it to monitor their condition, provide early warning signs and facilitate the development of self-awareness of their triggers. Overall, the ultimate goal is to enable patients to take control of their condition. In other words, we want to allow people to benefit from the data they themselves are constantly generating and help them to use it, when they want, to monitor their mood. And, more importantly, we want to do this in a way that respects their privacy and keeps their data safe.

From a machine learning perspective, this project is interesting because it would require the development of algorithms that could work locally in order to protect people’s privacy (i.e. analysis should be done at each person’s home instead of in a centralised database), while also work with sparse or incomplete data (i.e. in the case that one person decided to turn off one of the sources of information).

This project is an on-going collaboration between the Faculty of Engineering, the Institute of Mental Health, and the Faculty of Science. Phase I was funded by  MindTech and its main goal was to explore the literature in the area and to engage with experts. We explored ethics, technical, legal and social aspects of four different sources of data (utility and device usage, car usage and driving style, banking and card transactions, and mobile phone usage) and carried out different engagement activities with patients groups and other researchers in the area.

These activities, particularly our engagement with patients’ groups, were extremely useful. Talking with people with mood disorders who are interested in self-monitoring their condition, helped us identify potential directions and issues from a usability perspective, such as the need for total customisation of sensor (i.e. the possibility of turning off particular sources of data, instead of all of them at the same time) –  or the possibility of adding additional sensors like sleep or activity sensors through wearables like Fit Bit.

For Phase II, we are hoping that we can carry out a pilot study in which we collect some data and develop machine learning algorithms able to cope with distributed information that might be scarce or incomplete.

Mercedes Torres Torres, Transitional Assistant Professor, Horizon Digital Economy Research

James Pinchin – Strava

Strava is a service which bills itself as ‘the social network for athletes’. It allows users to store and share details of their activities, usually location records from runs or bike rides. Through sharing users can compare their performance and even (sometimes controversially1,2,3) compete over ‘segments’. Engineers at Strava are not ignorant to the value of their dataset. Staff in their ‘labs’4 are using the data to increase the size of their user base and sustain users engagement with their service.

Recently they released a global heatmap5 which they claim contains data from one billion activities and three trillion recorded locations. Given the size of the dataset, the lack of named users and the provision of (optional) ‘privacy zones’ in the Strava service5 you might expect this to be an interesting piece of internet ephemera, mostly of interest to runners and cyclists planning their next route. However users were quick to find other valuable information in the dataset.

As many global news outlets noted – not only the location, but also the layout of sensitive military sites were unwittingly revealed by the activities of fitness conscious personnel6,7. The suggestion from Strava8, the press and military leadership – military personnel should make use of privacy features, not use activity tracking apps in these places and don’t worry, Strava will work with military and government officials to filter ‘sensitive data’.

Nobody seems to be asking if Strava really needs to collect and store this location information. Can a service survive which provides locally calculated segment times, performance figures and comparative analyses without the need for users to reveal full location information in the first place? Is it possible to extract societal and monetary value from location time series without crossing security and privacy barriers? My answer is yes, and that’s what my research is about.

1http://nymag.com/daily/intelligencer/2014/09/did-a-cycling-app-contribute-to-bike-death.html

2http://www.latimes.com/business/la-fi-tn-strava-dopers-20160415-story.html

3 http://www.mamilsports.com/cycling/strava-beef-goes-viral-aussie-cyclists-trade-insults-kom-leaderboard/

4 https://labs.strava.com/

5 https://labs.strava.com/heatmap/#7.00/-120.90000/38.36000/hot/all

6 https://support.strava.com/hc/en-us/articles/115000173384-Privacy-Zones

7 https://edition.cnn.com/2018/01/28/politics/strava-military-bases-location/index.html

8 https://www.theguardian.com/world/2018/jan/28/fitness-tracking-app-gives-away-location-of-secret-us-army-bases#

9 https://blog.strava.com/press/a-letter-to-the-strava-community/


Tracks in the Strava global heatmap created by users exercising on the decks of ships moored at Portsmouth naval base, UK.

©Strava 2017 ©Mapbox ©OpenStreetMap

James Pinchin, Transitional Assistant Professor, Horizon Digital Economy Research

Stuart Reeves

Recently I have been working on a couple of ongoing investigations. One is based around examining what UX practitioners–as distinguished from HCI researchers–do when they are performing user research. The other, with Martin Porcheron and Joel Fischer, is exploring how people use speech-based ‘assistants’ in the home, such as the Amazon Echo.

Since its earliest days, a core concern of HCI research has been invested in developing ways of locating and dealing with the problems users of interactive systems might encounter. The terminology and concepts have changed over time, from notions of usability to more recent ideas about user experience. But much of this work has overlooked a couple of important aspects. Firstly, how problem identification is practically achieved (e.g., via user testing), and secondly that there is significant daylight between academic and practitioners’ applications of various evaluation methods. Recently I’ve combined these interests by examining how industry practitioners perform user testing as one piece of a broader project lifecycle. The reason why I’m doing this work is that HCI has only a limited (but growing) understanding of ‘what practitioners do’ in spite of much lip service being paid to the importance of academic HCI outputs and their potential operationalisation in practice. If we don’t really know what they are doing, then it is arguable whether HCI can reasonably make such claims. Another reason to focus on practitioners’ work practices is because I feel that HCI itself can learn much from various innovations and ways of working that might be taking place in that work.

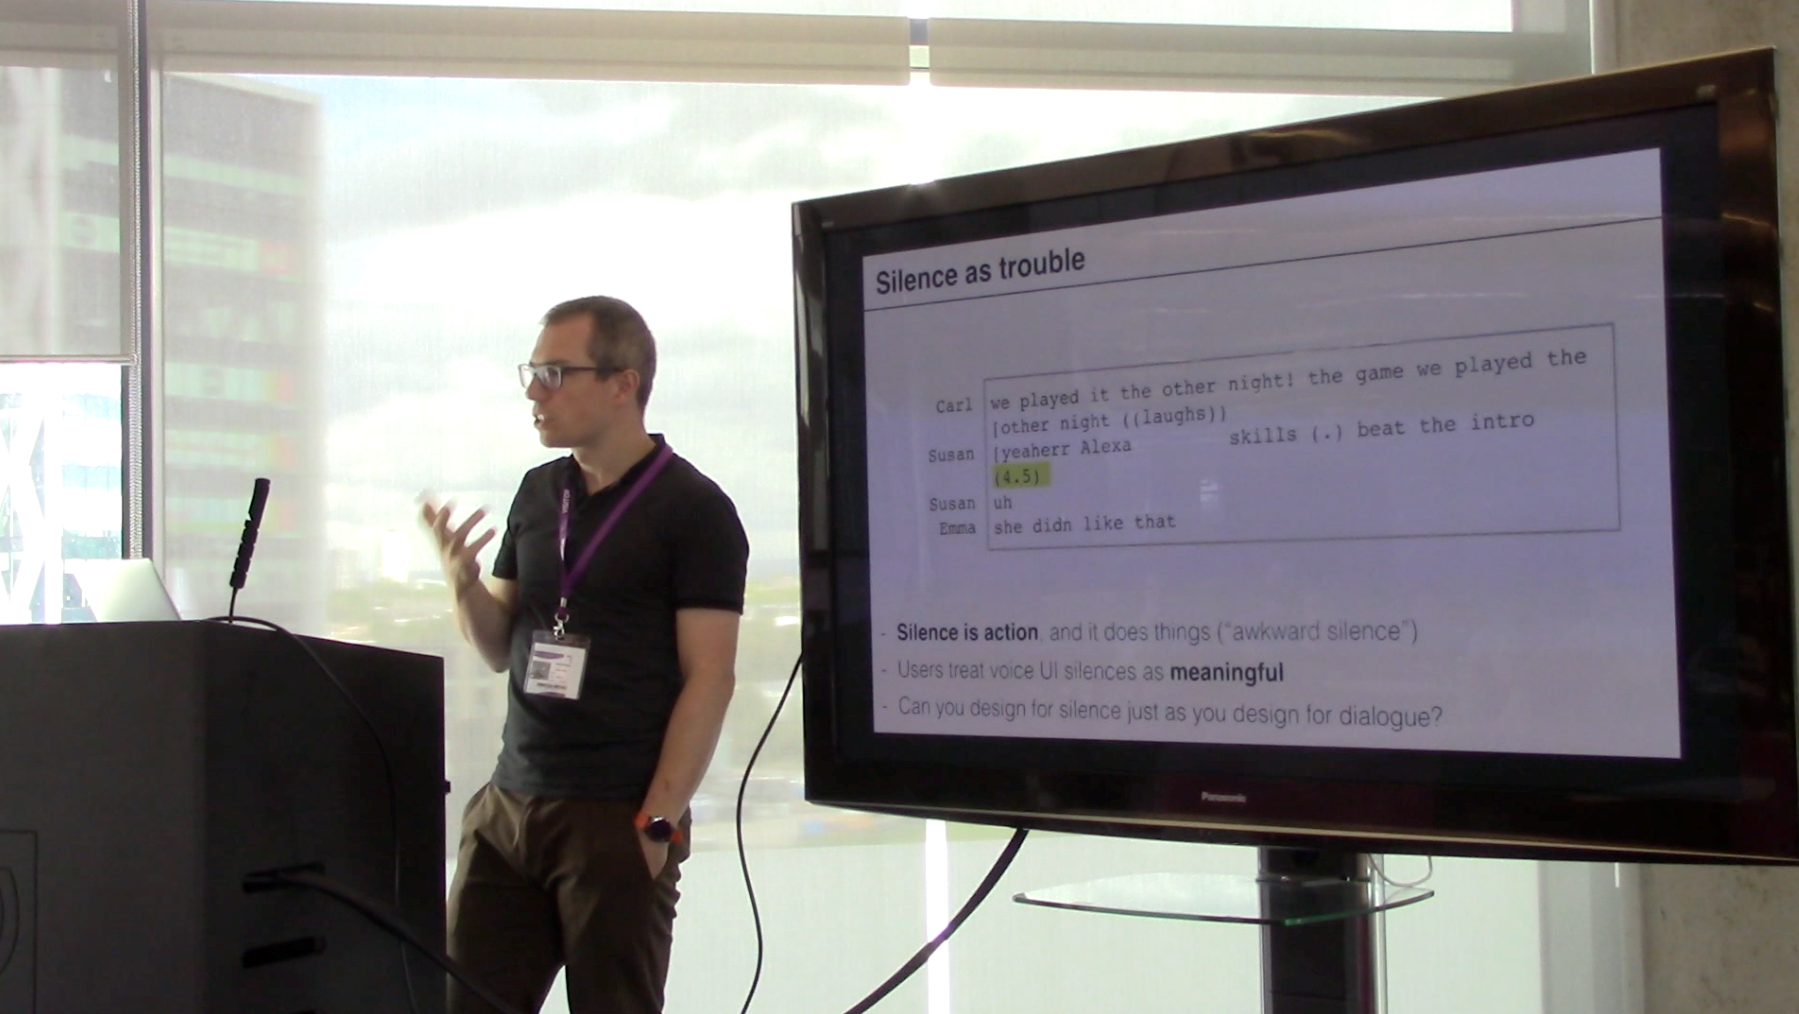
Recently I have been involved in examining empirical data about the way that people interact with voice user interfaces, conversational assistants and so on. In particular we (Martin Porcheron, Joel Fischer) have spend some time examining the organisation of talk with / around the Amazon Echo, that Martin has deployed to various homes as part of his PhD work. While there is a paper on this work that has been recently accepted to CHI 2018, I can detail a few of the key findings here. The Amazon Echo is positioned as a voice assistant for the home that can answer questions, help with cooking, and play music (amongst other things). Martin’s data shows how users of the Echo must develop particular ways of talking ‘to’ the device and managing the various interactional problems that they encounter (e.g., recognition problems, or knowing what they can actually do with it). Users also seem to approach the device more as a resource to ‘get something done’ than an agent that one can have a ‘conversation’ with. Finally, we believe that there are some potential implications for design in this work, such as ways that one might move towards considering ‘request and response design’ instead of potentially misguided ‘conversation design’ metaphors.

Stuart Reeves, Transitional Assistant Professor, Horizon Digital Economy Research