Horizon TAPs

A key feature of Horizon is our transitional fellowship scheme – this recruits highly talented research fellows into the academic career track, providing time and space initially to allow a greater focus on developing their research portfolio and leadership skills. This mechanism also permanently embeds the practices of cross-disciplinary digital economy working into key academic units throughout the university of Nottingham. 

Find out more about the research interests of our current TAPs

Our new TAPs

We are delighted to announce our new Transitional Assistant Professors:

Georgiana  Nica-Avram

Horia Maior

Helena Webb

Neelima Sailaja


Stuart Reeves – disseminating research on voice interfaces to UX and design practitioners

This is a short story about how our team—myself, Martin Porcheron, and Joel Fischer —disseminated our research on voice interfaces to UX and design practitioners through a varied campaign spanning over a year and a half to the present.

It began with a technology field trial that formed part of Martins PhD, during which he collected many hours of audio recordings of Amazon Echo use in domestic settings where the devices were deployed for a month. While working towards our first major academic milestone — a CHI 2018 paper (which was submitted in September 2017), we also began discussing and presenting early versions of this work-in-progress with practitioners.

This engagement with practice grew from exchanges with the BBC UX&D design research team with whom we discussed our emerging research and its results. Subsequently this led to us conducting a BBC UX&D “Studio Day” workshop that enabled us to do a more focussed presentation, coupled with a practical exercise for groups of UX&D practitioners, to consider issues raised when designing for voice interfaces. Performing this mini-workshop helped engender a more meaningful discussion than simply presenting what were then very preliminary results.

We presented our work publicly to the Cambridge Usability Group (CUG), and to a UX agency in London. Both activities led us to consider taking the material to a larger conference.

To begin with, these initial engagements with smaller audiences of practitioners enabled us to gauge what might be interesting and relevant for them, as well as providing us with a better sense of what kind of involvement with voice interfaces was realistic for designers. They also enabled us to gradually ‘prototype’ our ideas and presentational formats in a way that integrated our (ongoing) work, allowing us to establish a ‘feedback’ between the research side of things (e.g., developing papers) and practitioner-facing talks.

With our CHI 2018 paper accepted, I then presented our work to Interaction18, a large interaction design industry conference organised by the Interaction Design Association (IxDA). The tight 15 minute slot offered by IxDA required significant sharpening in order to maximise our work’s relevance and impact. My talk at Interaction18 was recorded and made more widely available by the conference organisers. I also decided to transform it into a Medium post which I made available soon after. This resulted in a positive uptake, 1.6k+ views on Medium and counting.

Presenting at a reasonably high-profile event for UX and design practitioners let us establish a formula—in miniature— that we could be confident with, that mostly seemed to ‘work’ for people and be of relevance – as evidenced by in-person feedback and further enquiries afterwards. Critically, it also generated further interest from practitioners in the form of invitations to speak about our work at other venues. In this way, smaller UX conferences and meetups followed and have built on this: The Research Thing, London in April; HCID Open Day at City, University of London in May; The Design Exchange, Nottingham in August; and the Service Design Meetup, London in October.

Whilst not clear as to what all this ultimately will lead to, we have a number of other future events and publications in development. It proves difficult to track and trace our impact on UX and design practitioner communities, even though we can capture how our learning as academics that engaging with practice has helped shape the research in various positive ways: increased conceptual clarity, focus, and a better appreciation for the value of different formats. All of these in turn help sharpen our standard academic dissemination and research approach.


A SOCIO-TECHNICAL APPROACH TO MISSING INCIDENTS

Photo by Leo Cardelli from Pexels

James Pinchin: “I’ve very much enjoyed supervising Kyle Harrington throughout his studies investigating human search behaviour in emergency situations in order to facilitate the development of safer walking technologies for vulnerable people. Co-supervised by Prof. Sarah Sharples, Kyle is based within the Human Factors Research Group and Horizon Digital Economy Research.  Kyle’s research was sponsored by Phillips Research”.

A Socio-Technical approach to missing incidents

Every year the police receive around a quarter of a million reports of missing people in England and Wales alone. Whilst the vast majority of those who become missing return home safely; people with additional care and support needs are far more likely to suffer from physical, emotional or psychological harm. Missing Incidents are not only traumatic for those involved, but are also likely to contribute to overall public spending; both with respect to the resources required for Missing Person searches, but also due to the increased likelihood of the breakdown of familial care following difficult to manage behaviours. Effective responses to these incidents are imperative, but there is little academic research which explores how these practices could be improved and no work at all investigating the decision-making of carers or parents during these incidents.

In his recently submitted thesis, Kyle Harrington draws together several disparate research areas, alongside original research, which helps to elucidate how those responsible for a person with care and support needs search, navigate and make decisions under stress. The work described in his thesis represents an attempt at a systematic understanding of how missing incidents unfold, how decision-making within missing incidents can be predicated, and ultimately what can be done to address the problem. With a focus on decision-making and technology; the thesis uses a three stage approach to describe, predict and address the problem of Missing Incidents. Several key design recommendations were produced which are intended to inform the design of new technologies for supporting missing person searches and may be of use to technology developers, policy-makers, care providers and other stakeholders

The Royal College of Physicians, safe medical staffing report and the relevance of mathematical sciences in real-world challenges.

On Friday 13th of July, the Royal College of Physicians (RCP), a British professional body dedicated to improving the practice of medicine, is due to release the safe medical staffing report, a comprehensive set of guidelines to improve current working standards and staffing within hospitals. It is now easily observable how secondary healthcare systems, both within the UK and abroad, are under increasing pressure. This is mostly due to growing patient admissions and a decline in available beds, along with an increase in the complexity of conditions and their necessary treatments. Arguably, healthcare systems must undergo major changes and optimise the use of limited (often human) resources, and the RCP seems to be in strong agreement with this interpretation of the current situation. Its large body of physicians and professionals has long been working in order to make positive contributions, helping to ease the working conditions of medical staff and improve the experiences of patients across this country.

On this occasion, the soon to be published staffing report will feature contributions borrowed from the extensive research of an interdisciplinary academic group of engineers, doctors, human factor researches and mathematicians within the University of Nottingham (see https://wayward.wp.horizon.ac.uk/). I have myself had the privilege of being part of this great team during the last 2 years. As a mathematician, I must confess this has been challenging at times; especially, when navigating through rooms full of clinicians, nurses and various stakeholders, trying to make sense of the important real-world challenges they face during their everyday life. In addition to that, I have experienced at several times how these professionals, with their different backgrounds, interests and opinions, often find it hard to grasp the exact nature of the work that a bunch of statisticians and scientists of the sort can do, and how it is we can contribute to very topical matters such as this one. If we don’t make a good job of communicating our work, we risk facing scepticism and marginalization.

 Thus, I would like to bring your attention to the fact that, the soon to be released RCP staffing report directly features outputs and key insights offered by statistical tools in the domains of queueing theory, Bayesian inference and Markov chain Monte Carlo, just to name a few. Luckily, there is no real reason why you should go on to Google these keywords; at times, it is up to us to abstract you from the technicalities and complex concepts, and put the focus on informative key findings that bring something to the table. Hence, I thought I would provide a few of the insights that came out of our data analyses and discussions with the various great teams at the Nottingham University Hospitals NHS Trust. The results here are only representative of the hospitals analysed, and data used was gathered during a 4 year time-span, from two major university hospitals jointly providing secondary healthcare to over 2.5 million residents in the United Kingdom. At the end of the post, you will find a list of references to some engineering, statistics and computer science publications that offer a rather comprehensive look at the (exciting!) mathematics lying at the heart of this work.

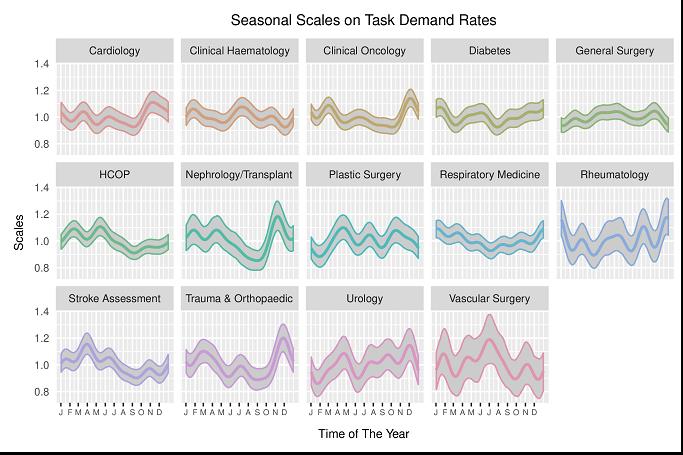
Have a look at the two figures above – you will find a bunch of colourful graphs showing what are seemingly temporal patterns distributed across various medical disciplines. The technical name to these is “Bayesian posterior credible intervals” – on a basic level, this is simply Bayesian analogue to a confidence interval, a.k.a. our favourite concept in that dreaded Year-1 statistics class. These ones reflect variations on average patterns of task demand in the hospitals, both weekly and year-round. Most importantly, these are not descriptive results, i.e. they don’t just average data here and there, nor are they built on strong assumptions common in practical low-level models. These results are extracted from a model of high complexity accounting for day-to-day dependence, random noise, distribution of observations … and the outputs reflect uncertainty regarding our confidence in the scales. So, why is this important? Why did the RCP or other physicians care? After all, they are nothing but confidence intervals, they tell us nothing for sure!

And that is precisely the point here. Patient arrivals, task demands, discharges, treatment times … these are all subject to such great noise. Ultimately, day-to-day work-demand within hospitals is, to a good extent, fairly unpredictable. As a consequence, every individual builds an (often very biased) opinion on the requirements, demands and plan of action necessary, usually based on their personal experiences. Hence, they have no means to factor for objective measures of certainty regarding what is predictable, and to what extent. In addition, they are good doctors, who devote their time to gain the skills that can ensure puts us on good hands; it is only to be expected that they have no expertise on designing the advanced mathematical frameworks that can offer an overview on workload, that is free of (most) sources of bias.

[1] Perez, I., Hodge, D., & Kypraios, T. (2017). Auxiliary variables for Bayesian inference in multi-class queueing networks. Statistics and Computing, 1-14

[2] Perez, I., Pinchin, J., Brown, M., Blum, J., & Sharples, S. (2016). Unsupervised labelling of sequential data for location identification in indoor environments. Expert Systems with Applications, 61, 386-393.

[3] Perez, I., Brown, M., Pinchin, J., Martindale, S., Sharples, S., Shaw, D., & Blakey, J. (2016). Out of hours workload management: Bayesian inference for decision support in secondary care. Artificial intelligence in medicine, 73, 34-44.


Mercedes Torres Torres & Joy Egede – Continuous Pain Estimation for Newborns or How Challenges in Conducting Research in a Clinical Setting Actually Made me a Better Researcher (I think) (Part II)

As part of their medical treatment, newborns in Intensive Care Units go through a number of painful procedures, such as heel lancing, arterial catheter insertion, intramuscular injections, etc. Contrary to the previous conception that newborns are not sensitive to pain, it has been shown that neonates do in fact have a higher sensitivity to pain than older children. In addition, prolonged exposure to pain and use of analgesics may have adverse effects on the future wellbeing of a child and could affect their eventual sensitivity to pain [1].

Nowadays, pain assessment in newborns involves monitoring some physiological and behavioural pain indicators, such as their brows, mouth, nose and cheeks’ movements. Trained nurses will take these measurements right after the procedure and will then monitor changes every two to four hours, depending on the seriousness of the procedure. However, this approach is highly subjective and does not allow for continuous pain monitoring, since doing this would require a large number of trained personnel.

As part of her PhD research, Joy developed an objective pain assessment tool to support clinical decisions on pain treatment. The system uses video, so it is able to provide continuous pain monitoring [2]. However, its development was not straightforward. Originally though to be used to measure pain on newborns, the design had to be changed due to lack of data.

Even after obtaining NHS Ethics approval the data capture process was too cumbersome. It required a Kinect camera to be set up before each different procedure, which then needed to be taken off. This was too time consuming for the team at Queen’s Medical Centre (QMC) in charge of data collection. This, in combination with low recruitment due to the sensitive nature of the procedures that were being recorded, made it virtually impossible to collect data in QMC.

However, through the Horizon Centre for Doctoral Training Impact Fund, we were able to establish a relationship with the National Hospital in Abuja (Nigeria), who agreed to collaborate with us. Staff there were particularly interested in the continuous aspect of the system, since they were dealing with such a large number of newborns on an everyday basis that constant monitoring was a challenge. After obtaining Ethics approval by the hospital panel and receiving training for appropriate procedure behaviour, we were allowed to collect data from different types of procedures, both painful and painless ones. Additionally, trained nurses and physicians helped with the recruitment of parents and newborns.

In three months, from October to December 2017, we were able to collect over 200 videos of infants undergoing painful and painless procedures. This has made a huge difference, since now we have actual relevant data with which to test the tool for assessment developed mentioned previously. Currently, we are working on getting the videos annotated by expert two nurses, and we are looking forward to modifying the general pain assessment tool created in [2] to measure pain on newborns automatically and continuously.

The authors of this post, Joy Egede and Mercedes Torres Torres would like to thank the staff of the National Hospital for their help and support. Moreover, they would like to thank all the parents and newborns who participated in the data collection.

[1] Page, G.G., 2004. Are there long-term consequences of pain in newborn or very young infants?. The Journal of perinatal education13(3), pp.10-17.

[2] Egede, J.O. and Valstar, M., 2017, November. Cumulative attributes for pain intensity estimation. In Proceedings of the 19th ACM International Conference on Multimodal Interaction(pp. 146-153). ACM.

Mercedes Torres Torres, Transitional Assistant Professor, Horizon Digital Economy Research

Mercedes Torres Torres – The GestATional Study or How Challenges in Conducting Research in a Clinical Setting Actually Made me a Better Researcher (I think) (Part I)

For my first postdoctoral position, I was lucky enough to become a member of the Gestational Project, a research project funded by the Bill and Melinda Gates Foundation that was a collaboration between the School of Computer Science and the School of Medicine at the University of Nottingham.

The goal of the project was to create a system that would combine photographs of a newborn’s face, foot and ear to calculate their gestational age right after birth. The gestational age of a baby is important because it measures how premature they are at birth, which directly influences the type of treatment that they will receive. The most accurate dating method right now is an ultrasound scan, but these machines are expensive, require trained personnel and cannot always be deployed to remote areas. In the absence of ultrasound scans, there is a manual method that can be used, the Ballard Score. The Ballard Score looks at the posture and measurements of a newborn in order to determine their gestational age. However, this method is highly subjective and results can vary widely depending on the experience of the person carrying out the exam.

The ultimate idea was to create an accurate system that would combine the objectivity and accuracy of an ultrasound scan and the postnatal measurements of the Ballard Score, therefore allowing non-trained personal to measure the gestational age of newborns. Such method would be useful in remote or under-funded areas where ultrasound machines or trained physicians might not be available or easily accessible.

I found the project fascinating and its area of application, healthcare, was new for me. In my PhD, I had worked in environmental problems, where, if I needed data, I could either download free images from sources like Geograph or go outside and take a picture of plants (you may think I’m exaggerating, but I am not). In other words, data collection was fast, straightforward and I had to think very little about its effects on the design of my algorithm. If accuracy was low, I could go through the motions again, download or take more photos, and see if that helped.

However, when I started working in this project, I realised that my data collection and maintenance habits had to become much more nuanced and serious. Just to get through NHS Ethics took 8 months, which is more than reasonable, since we needed to take photographs of such a protected group. But, even after getting the approval, recruiting participants was, also understandably, a challenge.

To ensure privacy and safety, images had to be stored in encrypted disks and access to them was limited to only the four people working on the project. Only the team at QMC were allowed to recruit and take the photos, so I had no information about the parents or newborns other than their photos and measurements. A downside of this measures is that I have never been able to express my thanks to all the parents (and babies!) who were generous enough to allow the team take photos, even when they were in dangerous circumstances. It was only due to their kindness that we were able to collect any data at all and to them we owe them the success of the project.

The characteristics of the data, including how challenging it was to collect, became a deciding factor in the design of the algorithm. If the accuracy in the calculations was low, I could not rely on additional and instantaneous data collection. Instead, I had to rethink the algorithm design and change it to work with the data we had. Incorporating these notions into our design, we were able to create a system that combined deep learning and regression and that  was able to calculate the gestational age of newborns with 6 days of error in the worst case scenario [1].

All in all, I can say that I loved working on the Gestational Project and that I learned a lot. I think that its challenges made me a more conscious researcher, one who treats data collection and management much more carefully now, independently of the area of application.

Right now, we are working to use the Centre for Doctoral Training Impact Fund to continue to increase the size and diversity of our dataset, hopefully collecting data in other parts of the country and the world. You can find more information about the GestATional Project here.

[1] Torres, M.T., Valstar, M.F., Henry, C., Ward, C. and Sharkey, D., 2017, May. Small Sample Deep Learning for Newborn Gestational Age Estimation. In Automatic Face & Gesture Recognition (FG 2017), 2017 12th IEEE International Conference on (pp. 79-86). IEEE

Mercedes Torres Torres, Transitional Assistant Professor, Horizon Digital Economy Research

Mercedes Torres Torres – Land-use Classification Using Drone Imagery

Land-use classification is an essential environmental activity that involves mapping an area according to the characteristics of the land. This is very useful because it provides information on the types of human activity being carried out in an area. The information in these maps can be then used to study the environmental impact that different planning decisions may have on a community. For example, national agencies will use land-use maps showing industrial, rural and residential areas to decide where different facilities, such as hospitals, or energy plants, or access, such as roads, should be built.

Different classifications can be used, depending on the level of detail needed. Simple classifications may distinguish two classes: buildings and non-buildings. More detailed classifications can include up to nine classes: urban, industrial, formal residential, informal residential, slums, roads, vegetation, barren, and water bodies.

While simpler classifications are easier to obtain, more detailed classifications offer a wider range of information and give a richer picture of the underlying organisation of an area. Nevertheless, while extremely useful, obtaining detailed land-use maps is no easy feat. The most accurate option remains employing human surveyors, who must be trained and are then required to travel to the area to be mapped, pen and paper in hand. As a consequence, manual classification can be subjective, time-consuming, labour-intensive and expensive.

The caveats are specially challenging in fast-developing cities with under-resourced local government. In these areas, centrally-organised mapping is difficult to maintain up to date due to lack of personnel and fast-paced changes in land purpose. Consequently, these areas could benefit from having an automatic way to produce land-use classification maps that is cost-effective, accurate, fast and easy to produce and maintain.

That was the purpose of the DeepNeoDem project. This AGILE project was a collaboration between Horizon Digital Economy Research, the NeoDemographics Lab at the Business School, and the Computer Vision Lab at the School of Computer Science. We used Fully Convolutional Networks (Long et al.; 2015) and drone imagery collected as part of the Dar Ramani Huria project, to show that it is possible to obtain accurate detailed classifications of up to nine different land-use classes.

Interesting results showed that, in some cases, such as the one showed in the figure below, FCNs were able to even beat human annotators, by picking up vegetation and roads which had not been annotated by humans.

Figure 1. FCNs are able to learn roads (red) that are not present in the manual annotations, as well as finding patches of vegetation (green) than were not annotated.

You can find more information in: “Automatic Pixel-Level Land-use Prediction Using Deep Convolutional Neural Networks” by M. Torres Torres, B. Perrat, M. Iliffe, J. Goulding and M. Valstar. Link here.

References:

[1] Long, J., Shelhamer, E. and Darrell, T., (2015). Fully convolutional networks for semantic segmentation. In Proceedings of the IEEE Conference on Computer Vision and Pattern Recognition (pp. 3431-3440).

Mercedes Torres Torres, Transitional Assistant Professor, Horizon Digital Economy Research